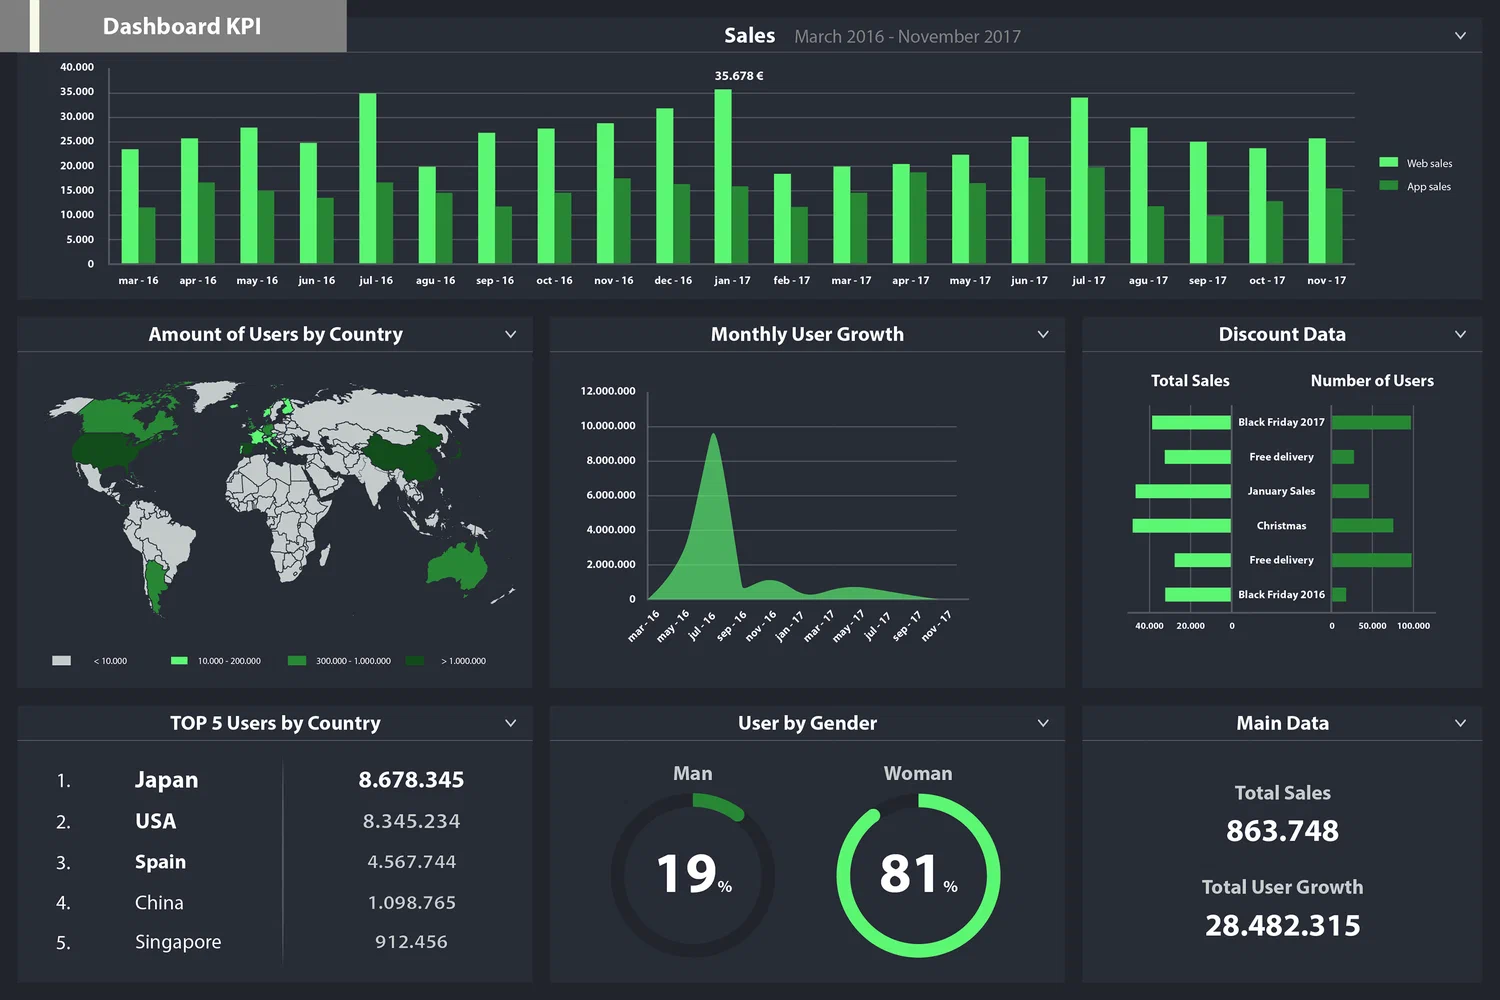
Businesses now have access to more information than ever before. However, the true challenge lies not in collecting data but in analyzing and acting upon it. Dashboards play a crucial role in helping businesses synthesize complex data into actionable insights, providing a clear and concise view of performance across various departments.
Here’s why dashboards are indispensable for modern businesses and how they can foster growth and efficiency.
The Importance of Dashboards
- Centralized Data Access
Dashboards integrate data from multiple sources, such as sales platforms, customer relationship management (CRM) tools, and marketing analytics. This eliminates the need to navigate through disparate systems, saving time and improving efficiency.
- Real-Time Monitoring
One of the most significant advantages of dashboards is real-time data updates. For instance, sales teams can monitor revenue trends, while marketing teams can track campaign performance. Real-time visibility allows businesses to respond quickly to issues or capitalize on emerging opportunities.
- Enhanced Decision-Making
With critical metrics displayed in a visual format, dashboards simplify complex data, enabling stakeholders to make informed decisions. Whether it’s identifying underperforming products or spotting areas of growth, dashboards provide the insights necessary for strategic planning.
- Improved Accountability
Dashboards can be customized to reflect the KPIs (Key Performance Indicators) of individual departments or employees. This ensures that everyone understands their performance metrics, fostering accountability and alignment with organizational goals.
- Time-Saving and Automation
Automated reporting via dashboards eliminates manual processes, saving countless hours. Businesses can schedule automated updates and focus on interpretation rather than data collection.
Examples of Essential Dashboards
Here are some examples of dashboards that highlight how businesses can analyze their performance effectively:
- Sales Performance Dashboard
A sales dashboard provides an overview of revenue, sales by region, conversion rates, and pipeline health.
- Key Metrics: Total Revenue, Sales Growth Rate, Average Deal Size, and Lead Conversion Rate.
- Visualization Tools: Bar charts to compare regional sales, a funnel for tracking lead progression, and line graphs for revenue trends.
- Marketing Campaign Performance Dashboard
Marketing teams use dashboards to measure the success of their campaigns.
- Key Metrics: Cost Per Lead (CPL), Return on Ad Spend (ROAS), Click-Through Rate (CTR), and Website Traffic.
- Visualization Tools: Pie charts for budget allocation, heatmaps for web traffic, and trend lines for CTR changes over time.
- Customer Service Dashboard
These dashboards track customer satisfaction and service efficiency.
- Key Metrics: Net Promoter Score (NPS), Average Response Time, First Contact Resolution Rate, and Ticket Volume.
- Visualization Tools: Gauges for customer satisfaction scores and stacked bar charts for ticket resolution.
- Financial Health Dashboard
Finance teams rely on dashboards to monitor cash flow, expenses, and profitability.
- Key Metrics: Net Profit Margin, Expense Breakdown, Accounts Receivable vs. Payable.
- Visualization Tools: Donut charts for expense categories, and waterfall charts for income vs. expenditure.
- Employee Performance Dashboard
Human resources use these dashboards to analyze workforce productivity and satisfaction.
- Key Metrics: Employee Retention Rate, Training Completion, and Productivity by Team.
- Visualization Tools: Bar charts for team productivity and scorecards for retention rates.
How Dashboards Drive Business Success
Dashboards empower businesses to transition from reactive to proactive strategies. For example:
- A marketing team can use dashboards to quickly identify campaigns that are underperforming and adjust strategies accordingly.
- Sales managers can spot a decline in conversion rates and retrain teams or modify sales tactics.
- Executives can review financial dashboards to ensure budget adherence and reallocate funds where needed.
Conclusion
Dashboards are no longer a luxury but a necessity for businesses aiming to stay competitive in today’s fast-paced market. By offering centralized, real-time insights, dashboards enable businesses to streamline operations, make informed decisions, and foster accountability. The ability to visualize data in an intuitive and meaningful way transforms raw information into a powerful tool for growth. Investing in robust dashboard systems is a step toward ensuring sustainable success and resilience in a data-driven future.


